What do AP Biology students need to know about statistics?

Updated: Jul 5
Scientists study how the universe works through testing and data analysis, which means the use of math is inevitable. AP Biology leans into data analysis in both the course design and exam questions. Students do need to know a wide range of biological facts, but those without sufficient analytical skills will not earn the highest exam scores. A statistics course is not a prerequisite for AP Biology, which often places the responsibility for teaching some introductory statistics on biology teachers.

Statistics in AP courses
To provide context, we can compare AP Biology to AP Statistics, based on the Course and Exam Descriptions (CED). Concepts such as confidence intervals and hypothesis testing are integrated throughout the AP Statistics curriculum. In AP Biology, these concepts are mentioned sporadically, and the focus is on utilizing provided information rather than making data analysis decisions. For example, AP Statistics requires students to "Construct a confidence interval, provided conditions for inference are met." AP Biology students must "Use confidence intervals and error bars to estimate whether sample means are statistically different."
It is noteworthy that no other AP science or social science (Psychology) course requires students to use statistics to the degree that AP Biology does (see chart below). The AP Biology CED contains the word "hypothesis" almost twice as much as the other six science courses combined! AP Biology is the only course other than AP Statistics that uses the term "null hypothesis." If a student doesn't take a statistics class (which is common for those on a Calculus track), AP Biology could be their only high school introduction to statistical testing. Based on discussions in the AP Biology community, teachers take this responsibility seriously.

So, what exactly do AP Biology students need to know about statistics? How are they going to be tested on that knowledge? What information is beyond what's necessary? This post will break it all down, based on the CED and the AP Classroom Question Bank.
Descriptive Statistics
Descriptive statistics summarize data and include measures of central tendency, frequency, and variability.
Central Tendency
Measures of central tendency include mean, median, and mode. It is reasonable to expect that students entering an AP science class are already familiar with these measures. However, students may not be familiar with the equation for the mean. The AP Biology Reference Sheet has both the equation and a description of the mean.

It is worth walking through the equation so that students are comfortable with what appears on the Reference Sheet. It also helps reinforce that technical-looking equations are often not as daunting as they appear, which will be useful when working with other equations, such as chi-square and Simpson's diversity index. The summation notation and index (i) mathematically communicate that all data points should be totaled for a sample of any size.


In the CED, Science Practice 5.A specifies that students should be able to calculate a mean, along with other required calculations. While calculating an average is used frequently throughout the course, AP exam questions are more likely to require using given means rather than doing the calculations. Most 5.A questions in the Question Bank require calculations involving rate, percent, or percent change.
Frequency
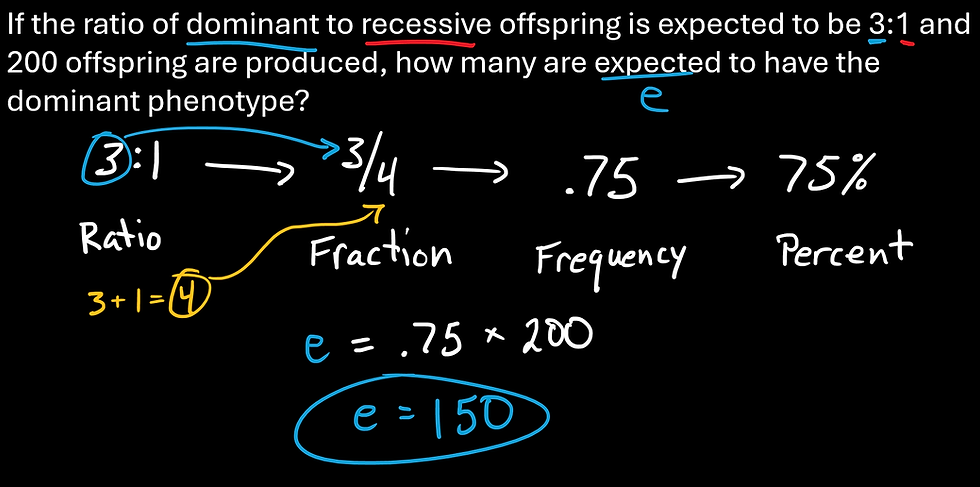
Descriptive statistics also include measures of frequency, including percentages and ratios. This is also addressed in Science Practice 5.A. As with mean, median, and mode, it is reasonable to assume that AP Biology students come into the course with the ability to do the necessary frequency calculations. While students can do the math, they may need practice applying these calculations to biology data situations. AP exam questions are likely to give percentages or ratios along with a sample size and ask students to find the number of individuals. This is a critical step to finding the expected values for chi-square tests.

Variablility
The final part of the descriptive statistics puzzle for AP Biology is variability. Measures of variability include range and standard deviation. Understanding range (and interquartile range) is likely to be a preexisting skill for most AP Biology students. Students should be able to identify and use the components of a box-and-whisker plot, including the median, maximum, minimum, upper quartile, and lower quartile. Box-and-whisker plots are among the graph types that students should be able to construct (Science Skill 4.A), but it is more likely that a question will provide the plot for students to interpret. I haven't seen (as of 2026) an AP released question or practice exam question that required students to draw a box and whisker.

Unlike range, standard deviation may be a newer concept for AP Biology students. The standard deviation equation appears on the Reference Sheet, but exam questions don't require students to perform the calculation. Standard deviation may be provided, along with an average, in a data table or as error bars on a graph (more on error bars later).
Standard deviation is a measure of variability that takes the whole data set into account. Standard deviation measures how much the data points differ from the mean. A low standard deviation indicates that most data points are close to the mean.

It is not necessary to discuss the difference between the sample and population mean/SD in AP Biology
Inferential Statistics
Inferential statistics are used to draw conclusions about a population, rather than simply describing a sample. This is the key to what statistics is all about: interpreting information. Inferential statistics can be messy and complex, with different decisions leading to different conclusions. AP Biology makes use of some inferential statistics, but with limits on the complexity and decision-making.
Standard error of the mean
The standard error equation is on the Reference Sheet, and like standard deviation, students are unlikely to be asked to do the calculation on the AP exam. Standard error indicates how precise the sample mean is. A low standard error indicates that the calculated sample mean is close to the actual mean of the population. The larger the sample size, the smaller the standard error.


AP Biology students do not need to be able to explain the difference between standard deviation and standard error. Students should recognize that both standard deviation and standard error give us information about how the mean represents a sample data set.
Standard error is tied to confidence intervals, which are a statistical way to talk about how sure we are that a parameter (in this case, the mean) falls within a certain range. That range is determined by adding and subtracting the standard error from the mean. If one standard error is used, we are 68% confident that the resulting interval includes the actual population mean. If two standard errors are used, we are 95% confident that the interval includes the population mean.

Science Practice 5.B specifies that students need to use confidence intervals and error bars to draw conclusions about the equivalence of sample means. Exam questions will give students either standard error, a graph with error bars, or both. AP Biology students need to use this information, but not produce, select, or explain it.
Understanding the connection between standard deviation, standard error, and confidence intervals typically involves discussion of the central limit theorem, the standard normal curve, and z-scores. This is beyond what is necessary for AP Biology.

Error bars
Error bars are a visual representation of uncertainty in graphed data. While error bars generally look the same, they can be based on different pieces of information, including standard error, confidence intervals, and standard deviation. Because error bars look the same, the measure used should be clearly labeled. Choices about what values to use for error bars are important because they can convey different information. If you want to dig into this more, check out Error bars in experimental biology.
AP Biology exam items are typically based on real research, so questions may represent data in a variety of different ways. Regardless of the error bar source, students are expected to use them to conclude whether or not groups are significantly different from each other. For AP Biology questions, if error bars overlap, the samples are not significantly different. If they do not overlap, the samples are significantly different. This is an oversimplification of statistical data analysis, but it does introduce students to an additional layer of analysis beyond simply looking at the means.

Students are likely to encounter error bars in multiple-choice questions (MCQs), as well as free-response questions (FRQs) 1, 2, and 6. Students should be prepared to include error bars on their constructed graph in FRQ 2 (if data is provided). AP Biology students do not need to make decisions about what measure (1SE vs 2SE vs Confidence Interval vs. SD) is appropriate for a situation. On the exam, students should use the data as it is presented. In addition to providing the information as error bars, information may be expressed in a table. In this case, the students will have to use the mean and the reported +/- value (typically 1 or 2 standard errors) to determine if there is overlap.
Hypothesis Testing
Hypothesis testing is used to evaluate and make decisions about a hypothesis. This usually involves a null hypothesis (H0), which is that there is no relationship between the compared groups or variables. This can involve a statistical test or examination of data using confidence intervals/error bars as described previously. The test outcome is either "reject" or "fail to reject" the null hypothesis.
Many different statistical tests exist and can be used based on the situation. AP Biology only uses the chi-square test (Science Practice 5.C), primarily in the context of heredity. The chi-square test evaluates whether observed data match expected data. The null hypothesis is that the observed and expected distributions are not significantly different.


To interpret results, the calculated chi-square value is compared to a critical value. This value comes from the chi-square table using a p-value and degrees of freedom. The chi-square table on the Reference Sheet lists p-values of 0.05 and 0.01, but students are not expected to choose between them; questions specify the significance level/p-value. For example, a student could be asked to use 3 degrees of freedom and a significance level of 0.05. In that case, the critical value is 7.82. If the calculated chi-square value is greater than the critical value, the hypothesis is rejected. For example, if the calculated value is 4.66, the test fails to reject the null hypothesis because 4.66 is less than the critical value of 7.82.

A few related terms are being used here: p-value, significance level, and critical value. Here's a brief explanation, but AP Biology students don't need to differentiate between them.
P-value: the probability that differences between the groups are due to chance.
Significance level: the threshold for rejecting the null hypothesis. If the p-value is lower than the significance level, the hypothesis is rejected.
Critical value: The calculated chi-square value is compared to the critical value. If the chi-square value is greater than the critical value, the hypothesis is rejected.

P-values can get confusing when you don't understand where the numbers are coming from (they come from a "reference distribution"). The easiest option for AP Biology students without a statistics background is to compare the critical value and the calculated chi-square value.

In the Developing the Science Practices section of the CED, a task listed for skill 5.C is to determine the p-value for a given data set. However, none of the MCQs in the Question Bank (as of summer 2026) require students to determine a p-value. One FRQ in the Question Bank does reward a point for interpretation in terms of p. The question is from the 2003 exam (not based on the current CED), and the maximum number of points (4 for the section and 10 overall) can be earned without mentioning the p-value. Based on the CED and available questions, I do not think students need to produce a p-value.
AP Biology students need to be able to do the following:
Calculate expected percentages (primarily for heredity predictions)
Calculate expected values (based on percentages)
Calculate the chi-square value (equation on Reference Sheet)
Determine the degrees of freedom (description on Reference Sheet)
Determine the critical value, given the p-value and chi-square table
Interpret the results based on the chi-square value and the critical value
A single question (MCQ or part of an FRQ) will likely require students to do only 1-2 of these. For a more detailed discussion of chi-square and examples, check out this post.
Summary
AP Biology is not AP Statistics, so when in doubt, don't sweat the statistical details. Students should be comfortable with descriptive statistics, and fortunately, this draws on preexisting math skills. In terms of inferential statistics, the most important concept is utilizing the overlap rule for error bars. This will come up on the exam, potentially in both the MCQ and FRQ sections. Students need to be able to perform all parts of a chi-square analysis, but don't need to understand the broader concepts like p-value.


Comments