How to use Chi-square in Biology classes
- Jolene Pappas

- Jul 21, 2025
- 9 min read
This post is written from an AP Biology viewpoint, but could apply to most introductory biology instruction, where students do not have prior knowledge of statistical tests.
Click here to skip to a summary of what exactly students need for AP Biology.
AP Biology navigates a delicate balance with statistical tests. The course is designed to help students understand the role of data analysis in science. However, it's not a statistics class, and there is no requirement for students to have taken a statistics class. AP Biology teachers and students can only go so in-depth with statistics and still be able to cover the wide range of biological concepts we are responsible for.
To simplify things a bit, only one statistical test, chi-square, is used in AP Biology. Chi-square is used to evaluate whether an observed set of data matches an expected set of data. The null hypothesis is that the observed and expected are not significantly different. There are variations in the approaches to chi-square, including the goodness-of-fit test and a test of independence (homogeneity and association are additional terms that come up in a more advanced/detailed statistical setting).
Chi-square tests
Goodness-of-fit is used when the expected proportions are determined separately from experimental data, based on a prediction. In a biology setting, this is frequently utilized in heredity problems. For example, if two pea plant traits result from two genes that are on separate chromosomes, we predict a 9:3:3:1 ratio of phenotypes in the F2 offspring.

The test of independence is used to determine if groups or variables are related. In this type of test, the expected values are calculated from collected data, rather than based on predictions. The expected calculations are based on determining combined probabilities based on the recorded data.
In terms of the math involved, the practical difference between these approaches is how the expected values are determined. The same equation is used to calculate the chi-square value, and the same table is used for interpreting the results. How the data was collected and the purpose of the analysis both play a role in determining which type of test to use, but this decision is beyond the requirements for most introductory Biology courses. Selecting the correct statistical test for a situation is generally for people who have completed a statistics course.
Expected values
How we find the expected values differs depending on whether we are performing a goodness-of-fit test or a test of independence.
Goodness-of-fit
For a goodness-of-fit test, we start with a prediction. Let's say we predict that a sample with four categories is evenly divided. This means that we expect each category to be 25%. We multiply the total of the observed data by the expected frequency for each category, in this case 25%.

Test of Independence
In a test of independence, the expected values are found using probability rules. Short version of the probability rules: OR means add, AND means multiply.
In this case, we start with the observed data.
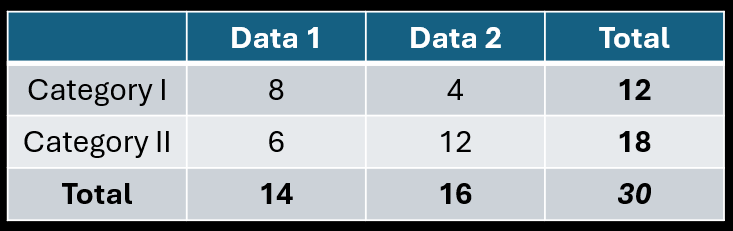
To find the expected value for Category I, Data 1, we do the following:
Find the frequency of individuals in Category I (either Data 1 OR Data 2): (8 + 4) / 30 = 0.4
Find the frequency of individuals in Data 1 (Category I OR Category II): (8 + 6) / 30 = 0.47
Find the frequency of Category I AND Data 1: 0.4 * 0.47 = 0.188
Use the frequency to calculate the expected number (multiply by the total): 0.188 * 30 = 5.6
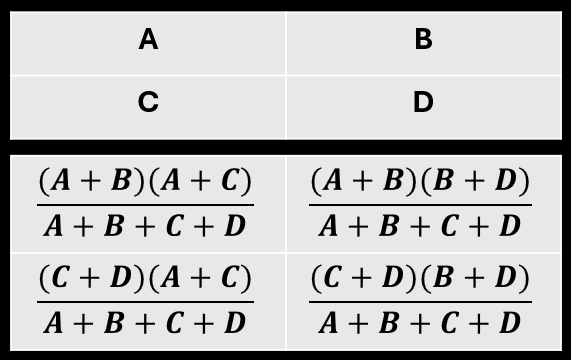
As an alternative to understanding what's going on with frequencies and probability rules, use the following chart as a guide. In summary, each expected value is the row total multiplied by the column total and then divided by the overall total.
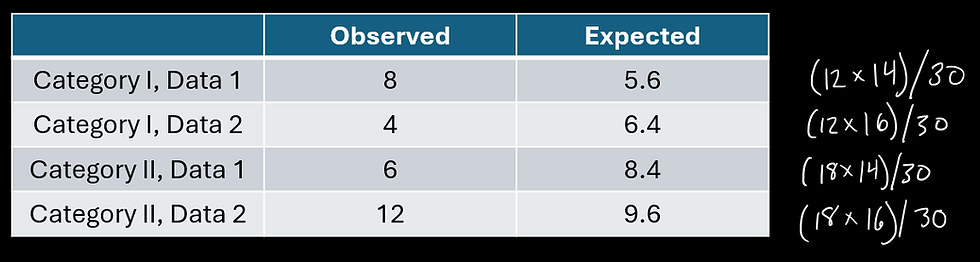
Here are each of the expected values from the sample.
Calculating Chi-Square
The chi-square equation is the same regardless of how the expected values were determined.

For the chi-square calculation, subtract the expected from the observed, square that, and then divide by the expected for each of the categories. Then add those values for the final chi-square value.

Degrees of freedom
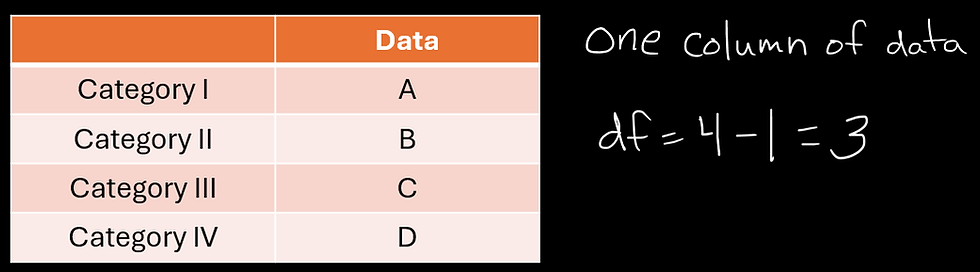
Degrees of freedom are the number of values in a data set that can change. This number is necessary to interpret the results of the chi-square test. The AP Biology Equations and Formulas sheet states, "Degrees of freedom are equal to the number of distinct possible outcomes minus one." For example, consider the following data set: 8, 4, 6, 12.
If the '8' is unknown (x, 4, 6, 12), but we know the average is 7.5, we can figure out what that unknown value is.
7.5 x 4 = 30
4 + 6 + 12 = 22
30 - 22 = 8
This shows that one of the values in this data set is not "free" to vary. But if more than one of the values was unknown, we could not identify them. For this data set, three of the values can vary. This is why the "possible outcomes minus one" definition found on the equation sheet works. The data set in the example has four values, so df = 4 - 1 = 3.
In AP Biology, this is the situation that students are most likely to encounter if they are required to find the degrees of freedom. In heredity problems, degrees of freedom are calculated by subtracting one from the number of different possible phenotypes. For example, a monohybrid cross that has two possible phenotypic outcomes has one degree of freedom. A dihybrid cross with four possible phenotypes has 3 degrees of freedom.

Things get a little more complicated when there are multiple values per category. In this case, when the data is arranged in a chart, df = (rows - 1)(columns - 1). Degrees of freedom are based on the data listed across rows as well as down each column.
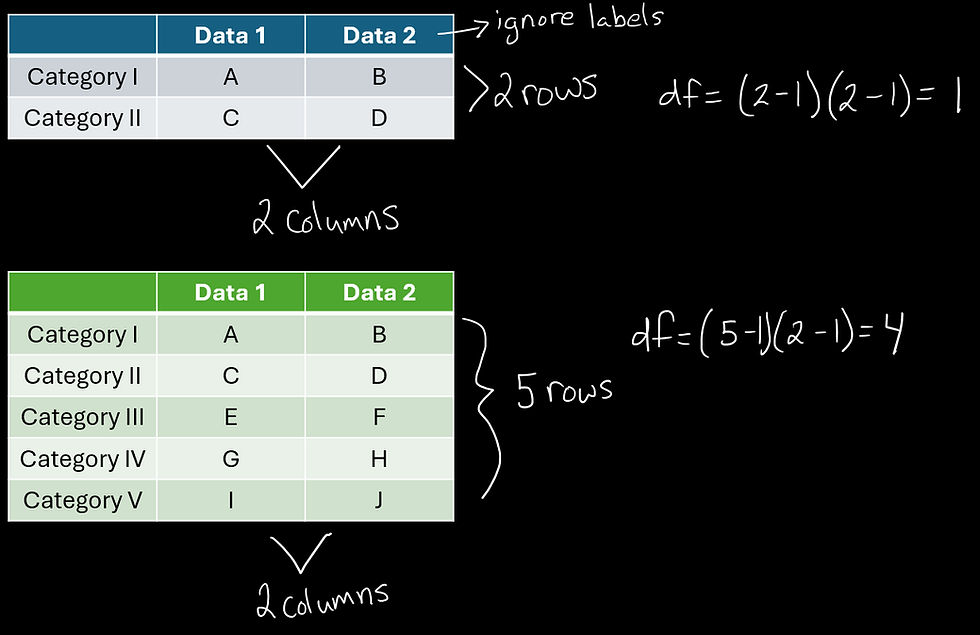
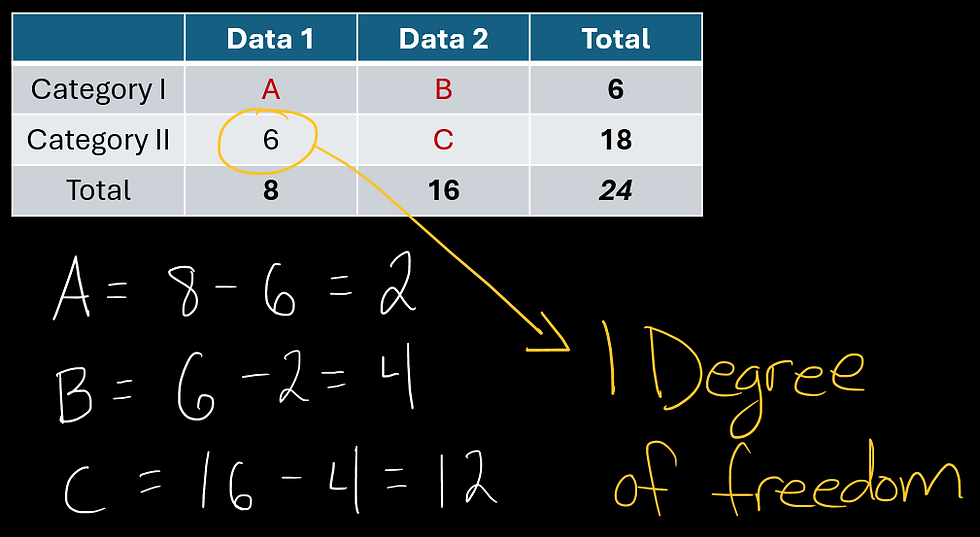
In a 2x2 table, if we know the totals for each row and column, and if we have at least 1 value, we can find any other value, so there is only one degree of freedom.
In these situations, it is easy for students to misinterpret the degrees of freedom, often calculating too many. In Part 2 of Investigation 7 from AP Biology Investigative Labs, there appear to be 4 categories: Mitosis and Interphase for the control and Mitosis and Interphase for the treated. Without additional instruction, this could be interpreted as 3 degrees of freedom.
However, the lab states that "The degrees of freedom (df) equals the number of treatment groups minus one multiplied by the number of phase groups minus one (T133, S90)." The lab does not explain to students why this is different than what we see on the formula sheet, but it does provide the correct outcome of 1 degree of freedom (df = (2 − 1) (2 − 1) = 1).

Hardy-Weinberg
Chi-square can be used to test if a population is at Hardy-Weinberg equilibrium (assume one gene, two alleles). This is done by using the frequency of an allele to calculate the expected frequencies, and from those, the expected values. See this post for a full breakdown of this process.

In these situations, there may be three phenotypes (if the heterozygous phenotype is different than both homozygous phenotypes). However, because we can do all the expected calculations based only on one of the two alleles, there is only 1 degree of freedom.

Interpreting Results
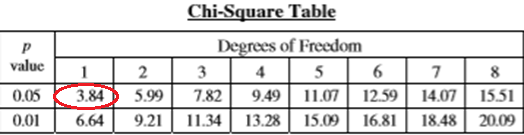
The critical value table helps us to interpret the chi-squared results. To find the critical value, we need to know the degrees of freedom and the p-value. The p-value is the probability that the results could be due to chance. Introductory biology situations typically use a p-value of 0.05, and in most situations the p-value will be specified by the lab/question.
To interpret the results, compare the calculated chi-square value to the critical value. If the chi-square value is greater than the critical value, the hypothesis is rejected. This means that the observed values do not match the expected. If the chi-square value is not greater than the critical value, then we fail to reject the hypothesis. Failing to reject the hypothesis means that there probably is not a significant difference between the observed and expected.
Examples
Heredity Example
If seed color (yellow is dominant to green) and seed shape (round is dominant to wrinkled) are unlinked and we cross two plants heterozygous for both traits, we expect:
9/16 of the offspring to be round and yellow,
3/16 to be wrinkled and yellow,
3/16 to be round and green, and
1/16 to be wrinkled and green.
The data below is the observed data.
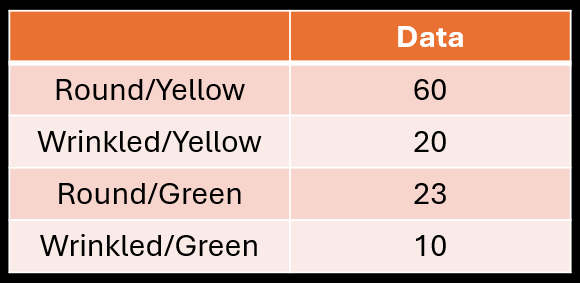
Because we have predicted ratios, we will use the goodness-of-fit approach here. The total number of plants produced in this example is 113. To find the expected values, we multiply the total by the expected proportions.
Round/Yellow: 113 * 9/16 = 63.56
Wrinkled/Yellow: 113 * 3/16 = 21.19
Round/Green: 113 * 3/16 = 21.19
Wrinkled/Green: 113 * 1/16 = 7.06
For the chi-square calculation, subtract the expected from the observed, square that, and then divide by the expected for each of the categories. For this example, the chi-square value is 1.65.
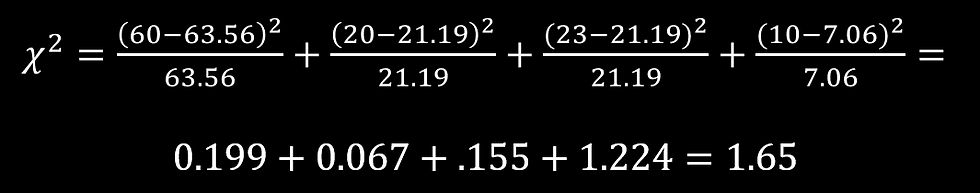
The degrees of freedom are 3, so at p = 0.05, the critical value is 7.82. 1.65 is less than 7.82, so we can't reject the hypothesis that the expected values are the same as the observed values. Conclusion: The two traits are not linked.
Mitosis Example
In this example, we are examining the effect of a treatment on cell division by counting the number of dividing and non-dividing cells in a control and treated sample. Instead of testing a prediction, we are examining whether the treatment affects the chances that a cell is dividing.
The table below shows the observed data for both the control and experimental (treated) groups:

The following chart has both the observed and expected values for this example. We find the expected values using the method described here.

For this example, the chi-square value is 6.11.

For this example, there is 1 degree of freedom, so at p = .05, the critical value is 3.84. 6.11 is greater than 3.84, so we reject the hypothesis that the expected values are the same as the observed values. Conclusion: The experimental treatment has an impact on the frequency of cell division.
Ecology Example
Let's say a student is studying whether the size of a pill bug affects what choices it makes in a choice chamber. The student has set up the choice chamber with a dark side and a light side. The table below shows the observed data.

The null hypothesis here is that length does not impact whether a bug chooses the light or dark side. This is a test for independence, so each expected value is (row total * column total) / total. For example, the 6-9 mm light expected = ((2+10) * (2+5+2)) / 40 = 2.4

For this example, the chi-square value is 0.678.

There are 2 degrees of freedom, so at p = .05, the critical value is 5.99. 0.678 is less than 5.99, so we cannot reject the hypothesis that the expected values are the same as the observed values. Conclusion: Pill bug length does not impact light choice.
What do AP Biology students need to know related to chi-square?
According to the AP Biology Course and Exam Description (2025), students should be able to
Write/identify a null hypothesis.
Calculate a chi-square value.
The chi-square equation and table are on the Equations and Formulas sheet (no need to memorize).
Interpret a chi-square value (reject/fail to reject null hypothesis).
Use chi-square for genetics problems (including finding the expected values and degrees of freedom).
Understand that chi-square is used in situations beyond genetics.
Understand that there are more statistical tests than just chi-square, even though this is the one used in this course.
Both tests for independence and goodness-of-fit can be used in AP biology questions; however, students do not need to differentiate between them. Based on the chi-square questions available in the AP Classroom Question Bank (as of July 2025), if students are asked to perform a calculation for a test of independence, they are provided the observed and expected values. Nearly all available questions where students are expected to calculate expected values are genetics questions (with one exception: a Hardy-Weinberg question from a practice exam).
Types of chi-square questions in the Question Bank on AP Classroom
Given a chi-square value, degrees of freedom, and a p-value, interpret the results (reject/fail to reject null hypothesis).
Given a heredity experiment description and a chi-square value, identify the critical value and interpret the results.
Given observed and expected values, a chi-square value, and a p-value, interpret the results.
Given observed and expected values, identify the critical value, calculate the chi-square value, and/or interpret results.
Given observed data for a heredity experiment, calculate the chi-square value.
Given observed data for a trait with two alleles producing three phenotypes, identify expected values for H-W equilibrium, calculate chi-square to test H-W equilibrium, and/or identify the critical value.

Comments