How to do mitosis lab analysis
- Jolene Pappas

- Jul 23, 2025
- 5 min read
*This post is geared towards AP Biology.
The Investigation
In Part 2 of Investigation 7 in the AP Biology lab manual (AP Biology Investigative Labs), students test the effect of an environmental change on the rate of cell division in an onion root, measured by comparing the numbers of dividing and non-dividing cells. The procedure calls for the presence of lectin as the independent variable. However, the procedure could be applied to different substances or environmental factors. For a quick, virtual lab, Biology Simulations has a cell cycle simulation with five treatment options and a control.
To complete the data collection, students need to be able to identify cells that are in a stage of mitosis versus cells in interphase. This lab does not require students to differentiate between the different stages of mitosis, although it is expected that an AP Biology student can do so.

Cell Cycle Labs
Biology Simulations offers five virtual lab worksheets for use with this simulation. Cell Cycle -Time is based on an old AP Biology Lab manual (2001, Lab 3A.2), and focuses on identifying the different stages of mitosis and calculating the amount of time spent in each mitotic stage and interphase. Cell Cycle - Treatments requires students to compare control data to experimental data, but does not require the use of statistical analysis. Cell Cycle - Error Bars asks students to calculate the standard error to add error bars to their graph. The other two versions both use a chi-square analysis. Cell Cycle - (Independence) Chi-square Analysis follows the more correct calculation for the situation and closely follows the analysis procedure in the current lab manual, while Cell Cycle - (Fit) Chi-square Analysis mirrors the type of chi-square utilized in the heredity unit.
Note: The term "independence" is being used here, even though from a statistical view, "homogeneity" or "association" would be more proper. See this post for a more complete description of what AP Biology students need to know about chi-square, and a discussion of the different chi-square situations that come up in the course.

Which version should AP Biology students do?
There are a few factors that teachers should consider when deciding which version of the lab to use.
Have your students already learned chi-square?
Do you want the chi-square test of independence to be a first introduction to chi-square?
In what other labs do you use a chi-square analysis?
How closely do you follow the AP Biology Investigative Labs lab manual?
Have your students constructed a graph with error bars?
In what other labs do you use error bar analysis?
Given the type of data collected, the independence version of the lab is the correct choice if you want to use chi-square. This is the version that matches the approach in the lab manual. However, this version of chi-square appears in fewer AP exam questions (based on the released and practice items in the AP Classroom Question Bank). For students without previous statistics training, this may be a more difficult starting place for chi-square instruction. The method for calculating the expected values is different from the questions that are likely to be tested on the AP exam, and the method for determining degrees of freedom is different from what appears on the AP Biology and Equations Sheet.
Another option is to skip the use of chi-square during this part of the course and teach it with Heredity and Evolution. As of July 2025, none of the chi-square questions in the AP Classroom question bank are about mitosis. There are, however, items in the bank that ask students to analyze graphs with error bars to answer cell cycle questions. I think this makes Cell Cycle - Error Bars a good activity for this unit.
If students are completely new to statistical tests, you could choose to use a goodness-of-fit approach, as it matches what is used in the Heredity Unit (Unit 5). If students are asked to calculate expected values on the AP exam, it will be in the context of a goodness-of-fit test, so extra practice with this is beneficial. For students without a statistics background, attempting to understand different applications of chi-square may prove to be confusing. Honestly, some of us teaching the class may be unprepared for an in-depth discussion of the differences.
Walk throughs
Let's look at how to do the analysis for the top two options for AP Biology: error bars and independence chi-square.
Error Bars
For this version of the lab, we'll be doing multiple trials with the simulation. For the calculations, we'll use the following set of sample data:

Students can calculate the mean, standard deviation, and standard error themselves, or they can use a spreadsheet or online calculator. In Google Sheets, AVG() is the function for the mean, while AVERAGE() is used in Excel. For standard deviation, use STDEV.S() in Excel and either STDEV() or STDEV.S() in Sheets. Note that we are using the sample standard deviation, not the population standard deviation (STDEV.P)

To find the standard error, divide the standard deviation by the square root of the sample size (in this case, 3).

There is no easy way to add standard error-based error bars to an Excel or Google Sheets graph. If you don't have a different digital graphing option available, students will need to do this graph by hand, or print out a bar graph and then add the error bars.

To draw a conclusion, check to see if the error bars overlap. If they do, then the conclusion is that the experimental treatment did not significantly impact the number of cells dividing in the samples. If there is no overlap, then the treatment did impact the number of dividing cells in the samples. In this example, the lower limit of the control error is almost 11 and the upper limit of the experimental error is about 4. Therefore, we can conclude that the treatment used reduced the number of dividing cells in the samples.
Chi-square (independence)
For this example, we'll start with the following data set. Using the simulation, each sample is 100 cells, so the overall total is 200.

To do the chi-square calculation, we'll first need to find the expected values. Each expected value is calculated by multiplying the row total by the column total and then dividing by the overall total.
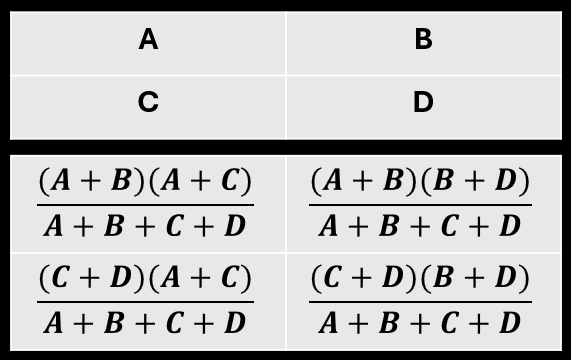

Once we have the expected values, we can complete the chi-square calculation using the equation. For each category (for example, Control Interphase), subtract the expected from the observed, square that, and then divide by the expected. Then add those values for the final chi-square value.


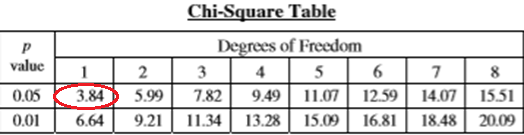
To complete the analysis, we use the chi-square table. To use the table, we need a p-value and the degrees of freedom. The p-value is the probability that the results could be due to chance. It is unlikely that a student in a general biology setting will have to independently decide on a p-value; it will be specified by the lab or question. We'll typically use a p-value of 0.05.
Generally, degrees of freedom are based on the data listed across rows as well as down each column. See the degrees of freedom section of this post for more information.
df = (rows - 1)(columns - 1)
In this example, we have two rows (Interphase and Mitosis) and two columns (Control and Experimental, so df = 1.

With the degrees of freedom and a p-value, we can determine the critical value using the chi-square table. In this case, the critical value is 3.84.
To draw a conclusion, compare the critical value to the chi-square value. If the chi-square value is greater than the critical value, the hypothesis is rejected, meaning that the observed values do not match the expected. In this example, 6.11 is greater than 3.84, so we can conclude that the expected values do not match the observed, and therefore the experimental treatment has an impact on cell division.
Note that with both approaches (error bars and chi-square analysis) we arrived at the same conclusion for this sample data.


Comments